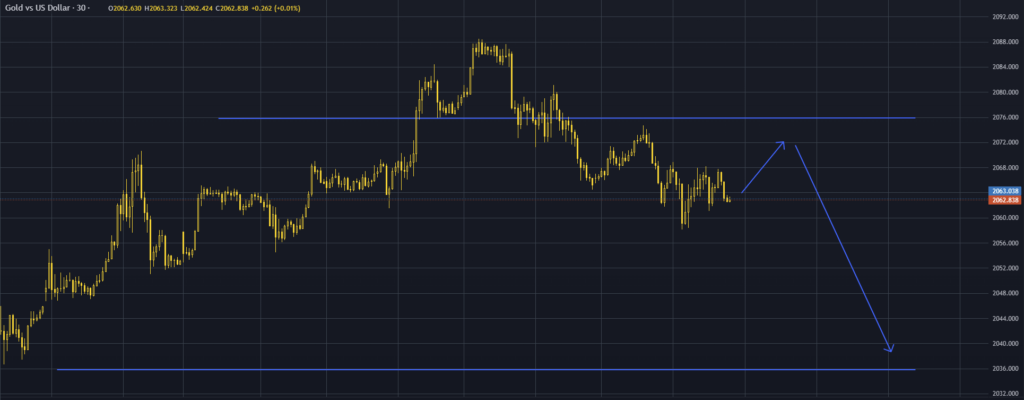
In the context of the gold trading market, particularly with reference to XAUUSD on 1 January, there has been a significant recent development. Where the price experienced a notable decline from a critical resistance level. This movement in the market is characterized by a classic technical pattern known as a “double top”. This formation is particularly telling as it indicates that the price has tested the resistance level not once, but twice, without managing to establish a new higher high. This lack of upward momentum is a clear indicator that the bullish forces in the market, those driving the price upwards, do not possess sufficient strength to surpass previous peak prices.

XAUUSD Context
The scenario became more pronounced when the price decisively broke through and closed below the pivotal 2070 level. This event is not just a minor fluctuation; it represents a significant shift in market dynamics. The breach of this level also coincided with a disruption of the trendline. Which is a key indicator of market liquidity and trader sentiment. Such a break is often seen as a confirmation of a change in the prevailing trend.
When we delve into the daily chart analysis, the situation becomes clearer. The closing price positioned itself below a critical juncture, a level which previously marked the commencement of a downward impulse. This is an important observation for traders and analysts alike. As such movements often indicate the beginning of a new trend. Adding to this bearish outlook is the formation of a long-tailed bar, commonly referred to as a bearish rejection bar. This is a technical signal often interpreted as indicating rejection of higher prices and a potential shift towards bearish sentiment.
XAUUSD Trading Idea for 1 January 2024
Based on these technical observations and market behaviors, there’s a prevailing expectation that the price might retest the support zone. Which lies in the range of 2037 to 2030. This is a crucial area to watch. As the price action around this zone could provide further insights into the market’s direction and strength.
The immediate target, from a bearish perspective, is around the support level of 2056.800. This level is of interest as it could serve as a potential reversal point or a consolidation area. Offering opportunities for traders to reassess their positions and strategies. This analysis is rooted in a careful consideration of recent price movements, technical patterns, and market sentiment. Providing a comprehensive view of the current state of the gold market.
