
On January 16th, I revisited the topic of the triangle pattern I had discussed in the market. Let’s focus on what’s happening with the XAUUSD currency pair today. It recently executed a significant move by breaking through what is known as the range zone. At the moment, the price is behaving differently. Instead of a clear upward or downward trend, it’s moving sideways. I interpret this sideways movement as a meaningful indicator. It suggests that the price is currently in an accumulation phase. This phase is typically a buildup period that often leads to a market trend shift, referred to as distribution.
Currently, the price is retesting a crucial level. This level is noteworthy because the price has shown a reaction to it in the past. It’s a level that has previously garnered respect from the market.
XAUUSD Context
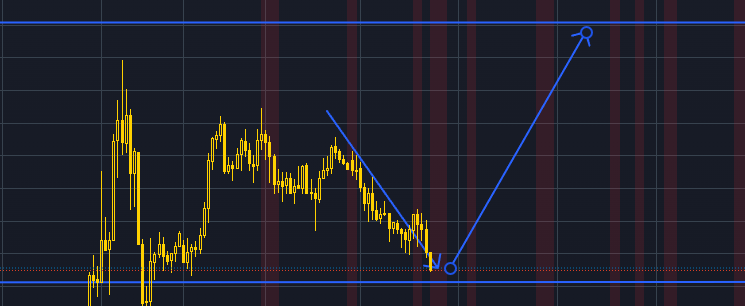
Looking ahead, I’m anticipating a specific market maneuver. I expect to see what I call a ‘fake breakout’ at the support level. This would mean a brief dip below the support level, followed by a reversal and an upward movement. I’m particularly interested in a point near the lowest price from the previous day. This point is key for what I describe as a ‘liquidity grab’. After reaching this point, my expectation is for the price to make a strong move and break out of the triangle pattern.
XAUUSD Trading Idea for 16 January 2024
However, there’s an alternative scenario. If the support level proves inadequate to sustain the price, we could witness a further decline. In such a situation, the price might drop to around 2030.
In this context, my objective is clear. My target is for the price to reach the resistance level, which currently stands at 2065, as of January 16th.