
On 5 February, traders seem to be cautious with their XAUUSD transactions, especially around the support levels that are between 2020 and 2030. When I analyze the one-hour chart for XAUUSD, I see a distinctive pattern. This pattern, a lower high, usually signals what’s known in trading as a 1-2-3 move. I think the price might struggle to break through the support level. So, I am keeping an eye out for a reliable indicator that it’s an opportune moment to buy. However, if the price dips below the 2020 support level, my attention will shift towards the zone around 2000. That zone could be pivotal for determining the direction of the next major price shift.
XAUUSD Context
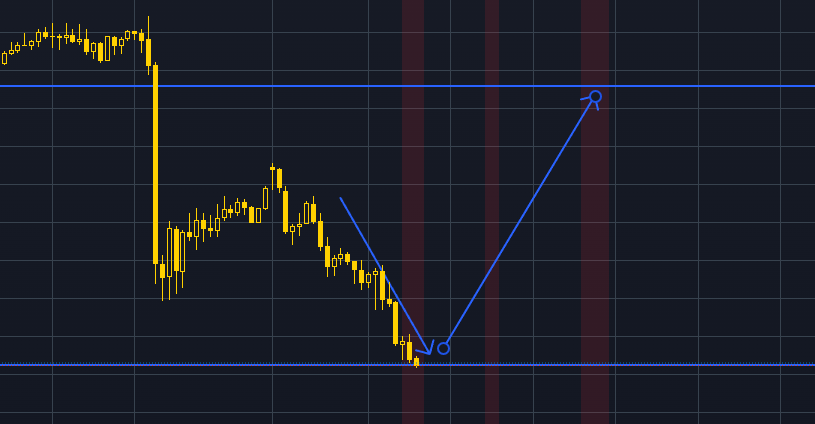
At present, the market doesn’t show a clear upward or downward trend; it’s moving sideways. It’s typical in such scenarios for the price to briefly exceed the highest or lowest points, only to quickly reverse its direction. If I notice a candle with a long tail on the chart, it often implies that the market doesn’t favor a further downward journey. When I see this, I expect the buyers, also known as the bulls, to enter the scene. They will probably attempt to elevate the price, setting their sights on the recent high point, which is at 2040.
XAUUSD Trading Idea for 5 February 2024
I am aiming for a particular target. I am meticulously monitoring the resistance zone at 2038.50. Reaching this level would mean that I have accomplished my trading goal for 5 February.